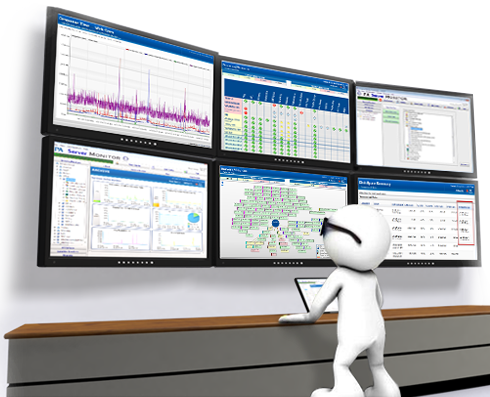
In real time environment, optimising the performance of the servers holds the key. In order to enhance the performance of the servers it is important to know related information about the system like CPU utilization, memory usage, network, disk I/O etc. In other words, it is essential to monitor these factors 24 x 7. High load surge and server downtimes are unavoidable and monitoring tools provide alerts in such critical situations. Some important monitoring tools are mentioned below.
Zabbix is an enterprise class monitoring system, which is written in PHP. Zabbix monitors the data and creates graphical representation of network statistics and CPU load factor. It sends alerts to users. A number of servers and virtual machines can be monitored at a time with Zabbix, because of its high performance and real time monitoring. Some of the features of Zabbix include distributed monitoring, SNMP, notifications via e-mail, SMS or Jabber. It also provides a web-based interface and an agent-less monitoring (ping, port checks). It is licensed under GPL.
Cacti is a front end RRD tool that gathers data, handles graphs and data sources. It also scales a number of data sources and graphs through templates. It is also written in PHP and licensed under GPL. However, Cacti does not provide alerts by default, so third party plugin installations have to be done for that purpose.
Nagios is the most popular web based Linux monitoring system available now. It helps to monitor the entire IT infrastructure. Nagios detect the problems even before they occur by spotting security breaches and thereby reducing downtime and business losses. It is free of charge and supports alerts like e-mail, sms, chat messages and phone call notifications. Here monitoring is limited to the states and does not show any graphs.
Munin is an open source application for monitoring and collection of data for networks, PCs and applications. It presents all the information in graphs through a web interface. Munin is programmed in Perl. It also needs some Perl modules to work properly. Munin has a master-node architecture. The “munin node” is a daemon, which runs on all servers that can be monitored. The “munin master” on the other hand connects to all munin nodes, collects data, and stores it in RRD.
Zenoss provides the fastest and precise view on the potentially affected servers. It delivers enterprise monitoring software that is Easy, Open and Complete. Some of the features of Zenoss are easier deployment and maintenance, automatic discovery and modelling of resources, flexibility and extensibility through ZenPacks. Zenoss Core is built on open source technologies like Zope Application server, Python, Net-SNMP, RRDtool, MySQL, Twisted and Lucene.
Observium is an open source monitoring application. This ‘do it all’ application expands the visibility of the network infrastructure by automatically collecting and displaying information about services and protocols that we may not monitor otherwise. It is an SNMP-based auto-discover network monitoring tool, which is a web application written in PHP. It provides CPU, memory and storage statistics along with interface traffic, packet and detailed error statistics. Temperature, fan speed, voltage, amperage, power humidity and frequency sensors are also displayed here.
Above listed are just a few of the widely popular server monitoring tools. There are many such tools available and using them is of great help for the system admins as well as the users.


I will immediately grab your rss feed as I can not in finding your email subscription link or newsletter service. Do you have any? Kindly permit me recognize in order that I may just subscribe. Thanks.